Search the Community
Showing results for tags 'degradation'.
Found 3 results
-
Hello everyone, I recently purchase a used 2017 Ford Fusion Energi Platinum i bought it in December 2021 from Galpin Ford i love it and honestly I’ve been happy with almost everything im just worried about my batteries degradation. I’ve read that cold weather reduces range and obviously driving style reduces range. But even when I don’t use the heater or AC, and when I get the “driving style” bar alll the way to the right. Most I’ve gotten was 18 miles per charge weather right now is about 50F My two questions: Is the trip summary accurate? At 48k miles is 3.6kwh too low for the range and age? I tried using the battery on the highway to see how many kwh my battery still has. From 100%-0, I only got 3.6kwh And to be clear I don’t mind driving slow for the longer range. I just want to know whether I should go warranty the battery because it’s too degraded.
-
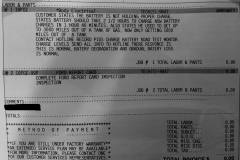
From the album: Untitled Album
Here is Ford's response to 33% battery degradation after 32,500 miles / 3 years. -
The following chart shows the degradation rates for an NCA Lithium-ion battery stored at a constant SOC and temperature (http://www.nrel.gov/transportation/energystorage/pdfs/53817.pdf). A description of the different types of Lithium-ion batteries can be found at the following link: http://www.batteryuniversity.com/learn/article/types_of_lithium_ion. This is the type of battery used in the Tesla Model S (http://batteryuniversity.com/learn/article/bu_808b_what_causes_li_ion_to_die). The type used in the Energi, Volt, and LEAF is NMC/Lithium Manganese Oxide (http://articles.sae.org/11705/). I suspect that the Energi HVB has higher degradation rates than NCA, but the degradation rates should be comparable. The top chart shows resistance growth which correlates with power loss. A 20% increase in resistance results in a 17% power output loss from the HVB. The bottom chart shows capacity fade rate which correlates with capacity loss. As an example how to read the bottom chart, consider a battery stored at 25 C and 100% SOC. The capacity fade rate from the chart is -4.7e-3/sqrt(day). To determine the time to 20% capacity loss, we compute (0.2/4.7e-3)^2 = 1810 days = 5 years. If you wish to compute the capacity degradation for a battery stored for one year (365 days) at 100% SOC and 30 C, look at the 100% SOC line in the bottom graph where it intersects a vertical line drawn through 30 C on the x-axis. This occurs at -5.2e-3/sqrt(day) fade rate on the y-axis. The degradation is then sqrt(365)*5.2e-3 = 10%. The dashed horizontal lines indicate the lifetimes for 20% capacity loss or resistance growth. For example, consider capacity loss. The 10 year line crosses the 80% SOC line at about 27 C in the bottom chart. That means the battery capacity loss will be 20% after 10 years if the battery is stored at 80% SOC and 27 C. The point on the 80% SOC line corresponding to 20 C is above the 10 year capacity loss line. That means that degradation of the battery will less than 20% after 10 years if stored at 80% SOC and 20 C. Based on the charts below, if you store the battery at 50% SOC for 10 years, the power loss and capacity loss should be less than 20% for HVB temperatures up to 35 C, or 95 F. The normal recommended SOC for storing Lithium-ion batteries is between 30% and 40%. If you store the battery at 30% SOC for ten years, degradation should be less than 20% for HVB temperatures up to 45 C, or 113 F. To minimize degradation, ideally you would want to store the battery at 0% SOC. But that is not recommended, especially for batteries that are connected to devices. Should the cell voltage fall below 3.0 V, the battery will be irreparably damaged. That can happen if the car draws too much power from the HVB when the SOC falls below 0%. So I would not want to drain the HVB to 0% SOC. Note that when MFT/MFM reports 0% SOC of the HVB, the actual SOC is about 20%. So you need to take that into account when using the SOC reported by MFT/MFM.
- 27 replies
-
- 1
-

-
- HVB
- Degradation
- (and 1 more)