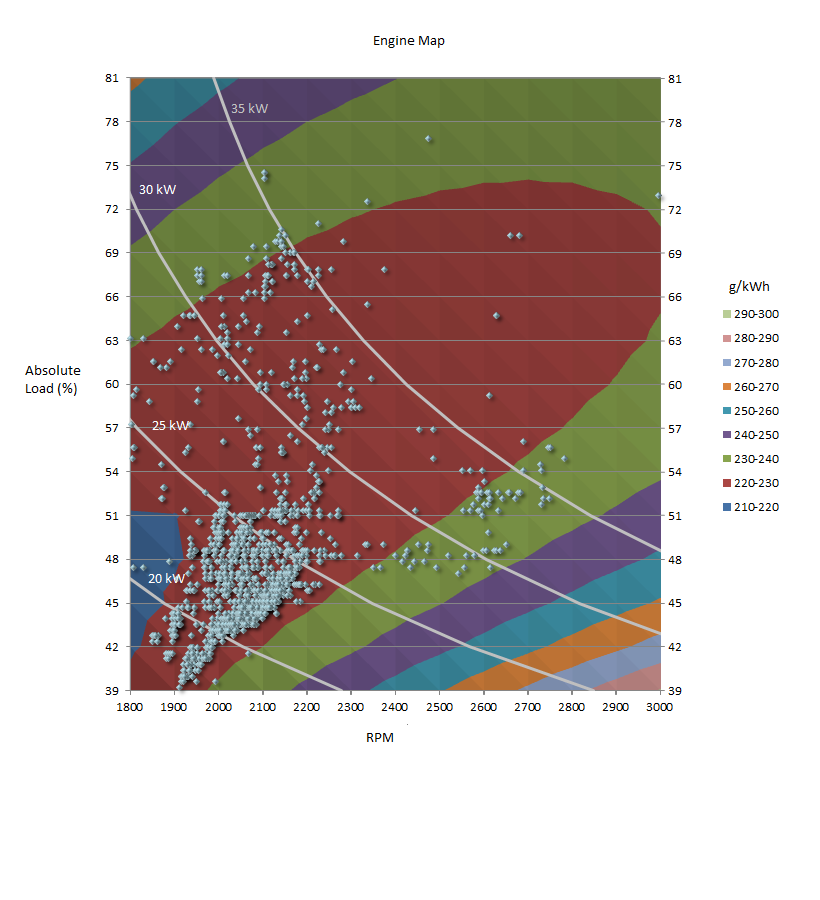
ICE Engine Map
The chart shows the fuel consumption in grams per kWh of energy output by the ICE for various RPMs and loads. The horizontal axis shows ICE RPM. The vertical axis shows Absolute Load, which is linearly correlated with torque. The colored contours show the fuel consumption per unit of energy. This was from OBD II data collected over several trips.


Recommended Comments
There are no comments to display.
Join the conversation
You can post now and register later. If you have an account, sign in now to post with your account.
Note: Your post will require moderator approval before it will be visible.