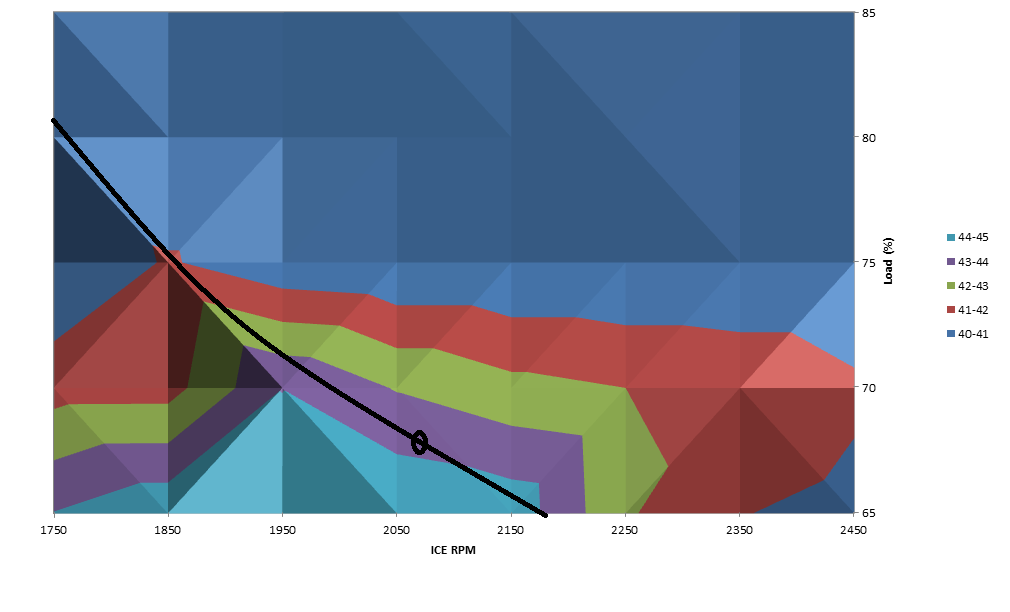
This chart shows efficiency of ICE as a function of RPM and % Load from the data for a 60 mile commute at 3 F. Efficiency increases with decreasing load. The line shows the possible operating points that provide sufficient power to go 65 mph. Efficiency is computed as RPM * % Load / gallons of gas per minute.


Recommended Comments
There are no comments to display.
Join the conversation
You can post now and register later. If you have an account, sign in now to post with your account.
Note: Your post will require moderator approval before it will be visible.